> ## Documentation Index
> Fetch the complete documentation index at: https://docs.jelou.ai/llms.txt
> Use this file to discover all available pages before exploring further.
# Response time traffic light
> Classify every conversation by how long it has been waiting for a reply so your team knows who to answer first.
Each conversation is marked with a color based on how long it has been waiting: an operator can see at a glance who to answer first, and a supervisor can spot which conversations are falling behind.
## The three statuses
The traffic light relies on two thresholds in minutes that your company defines:
| Status | Color | When it applies |
| ----------------- | ------ | ------------------------------------------------- |
| **On time** | Green | The wait is below the "On time" threshold |
| **Delayed** | Yellow | The wait is between "On time" and "Serious delay" |
| **Serious delay** | Red | The wait exceeds the "Serious delay" threshold |
The middle status (**Delayed**) is not configured: it is derived automatically from the range left between the other two.
## Prerequisite
Nothing is displayed until **at least one threshold configuration is saved** and the main toggle is on. Without that, conversations look exactly as before, with no color indicator.
## Configure the thresholds
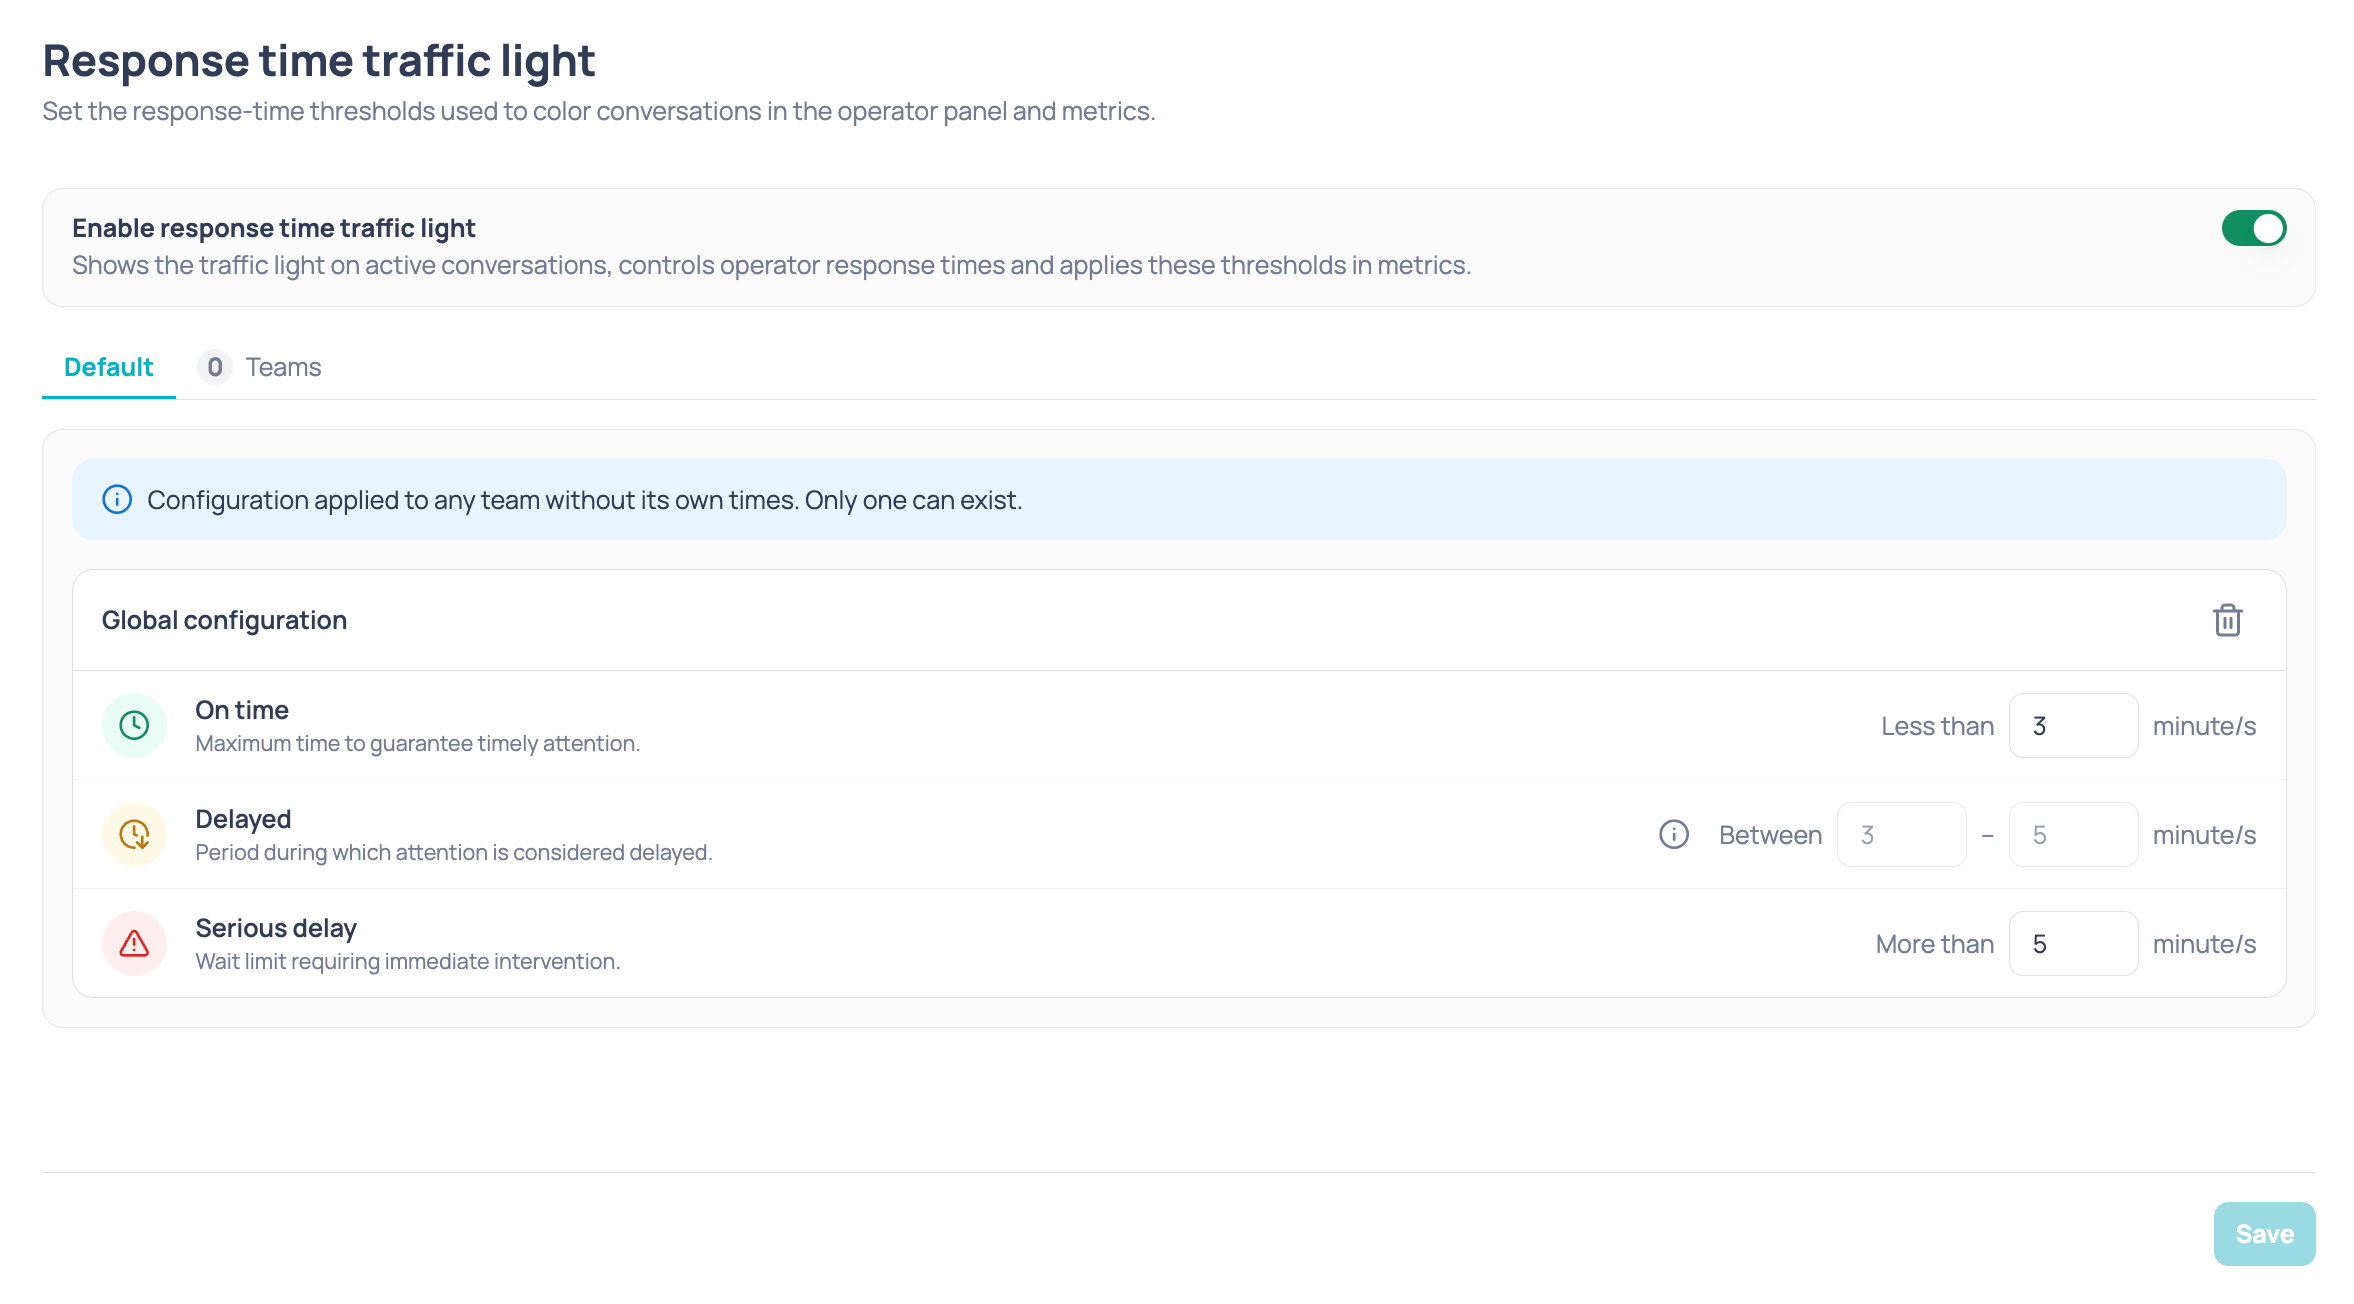
Go to **Settings > Response time traffic light**. The screen has a main toggle at the top and two tabs below it.
 ### Main toggle
**Enable response time traffic light** turns it on or off for the entire company. While it is off, the tabs below remain visible but dimmed and cannot be edited.
If an active configuration already exists when you open the screen —global or for a team— the toggle appears turned on automatically.
### Default tab
This is the configuration applied to **any team that does not have its own times**. Only one can exist.
If there is none yet, you will see the **Add configuration** button. Creating it displays a card with three rows:
| Row | What it defines | Editable field |
| ----------------- | -------------------------------------------------- | ------------------------------------------- |
| **On time** | Maximum time for support to be considered timely | "Less than" *N* minutes |
| **Delayed** | Period in which support is considered late | Read-only: calculated between the other two |
| **Serious delay** | Waiting limit that requires immediate intervention | "More than" *N* minutes |
Value rules:
* They must be whole numbers between **1 and 120 minutes**.
* **On time** must be lower than **Serious delay**.
* The **Delayed** row adjusts on its own when you change the other two.
The trash icon on the card deletes the default configuration.
### Teams tab
This lets you define different thresholds for groups of teams. The tab shows a counter with the number of configurations created.
Each team configuration has:
| Field | Description |
| ----------------- | ----------------------------------------------- |
| **Teams** | Multi-select. At least one team is required |
| **On time** | Same field and same rules as in the Default tab |
| **Delayed** | Read-only, calculated |
| **Serious delay** | Same field and same rules as in the Default tab |
Keep in mind that:
* **A team can only belong to one configuration.** Teams already used in another card appear disabled in the selector.
* Cards collapse and expand by clicking their header. If a collapsed card has an error, the error is shown in the header.
* **Add configuration** creates a new card; the trash icon deletes it.
* Teams you remove from a configuration go back to using the **Default** configuration.
### Save changes
A single **Save** button saves the default configuration and any changed team configurations at once. When it finishes, a success or error message appears.
Changes apply immediately: operators don't need to reload their session for the traffic light to start using the new thresholds.
## Where the traffic light appears
### In the Inbox
* **Chat list**: a colored icon next to each conversation. Hovering over it shows the status label.
* **Header of the open conversation**: the same status, as a chip with text.
### Main toggle
**Enable response time traffic light** turns it on or off for the entire company. While it is off, the tabs below remain visible but dimmed and cannot be edited.
If an active configuration already exists when you open the screen —global or for a team— the toggle appears turned on automatically.
### Default tab
This is the configuration applied to **any team that does not have its own times**. Only one can exist.
If there is none yet, you will see the **Add configuration** button. Creating it displays a card with three rows:
| Row | What it defines | Editable field |
| ----------------- | -------------------------------------------------- | ------------------------------------------- |
| **On time** | Maximum time for support to be considered timely | "Less than" *N* minutes |
| **Delayed** | Period in which support is considered late | Read-only: calculated between the other two |
| **Serious delay** | Waiting limit that requires immediate intervention | "More than" *N* minutes |
Value rules:
* They must be whole numbers between **1 and 120 minutes**.
* **On time** must be lower than **Serious delay**.
* The **Delayed** row adjusts on its own when you change the other two.
The trash icon on the card deletes the default configuration.
### Teams tab
This lets you define different thresholds for groups of teams. The tab shows a counter with the number of configurations created.
Each team configuration has:
| Field | Description |
| ----------------- | ----------------------------------------------- |
| **Teams** | Multi-select. At least one team is required |
| **On time** | Same field and same rules as in the Default tab |
| **Delayed** | Read-only, calculated |
| **Serious delay** | Same field and same rules as in the Default tab |
Keep in mind that:
* **A team can only belong to one configuration.** Teams already used in another card appear disabled in the selector.
* Cards collapse and expand by clicking their header. If a collapsed card has an error, the error is shown in the header.
* **Add configuration** creates a new card; the trash icon deletes it.
* Teams you remove from a configuration go back to using the **Default** configuration.
### Save changes
A single **Save** button saves the default configuration and any changed team configurations at once. When it finishes, a success or error message appears.
Changes apply immediately: operators don't need to reload their session for the traffic light to start using the new thresholds.
## Where the traffic light appears
### In the Inbox
* **Chat list**: a colored icon next to each conversation. Hovering over it shows the status label.
* **Header of the open conversation**: the same status, as a chip with text.
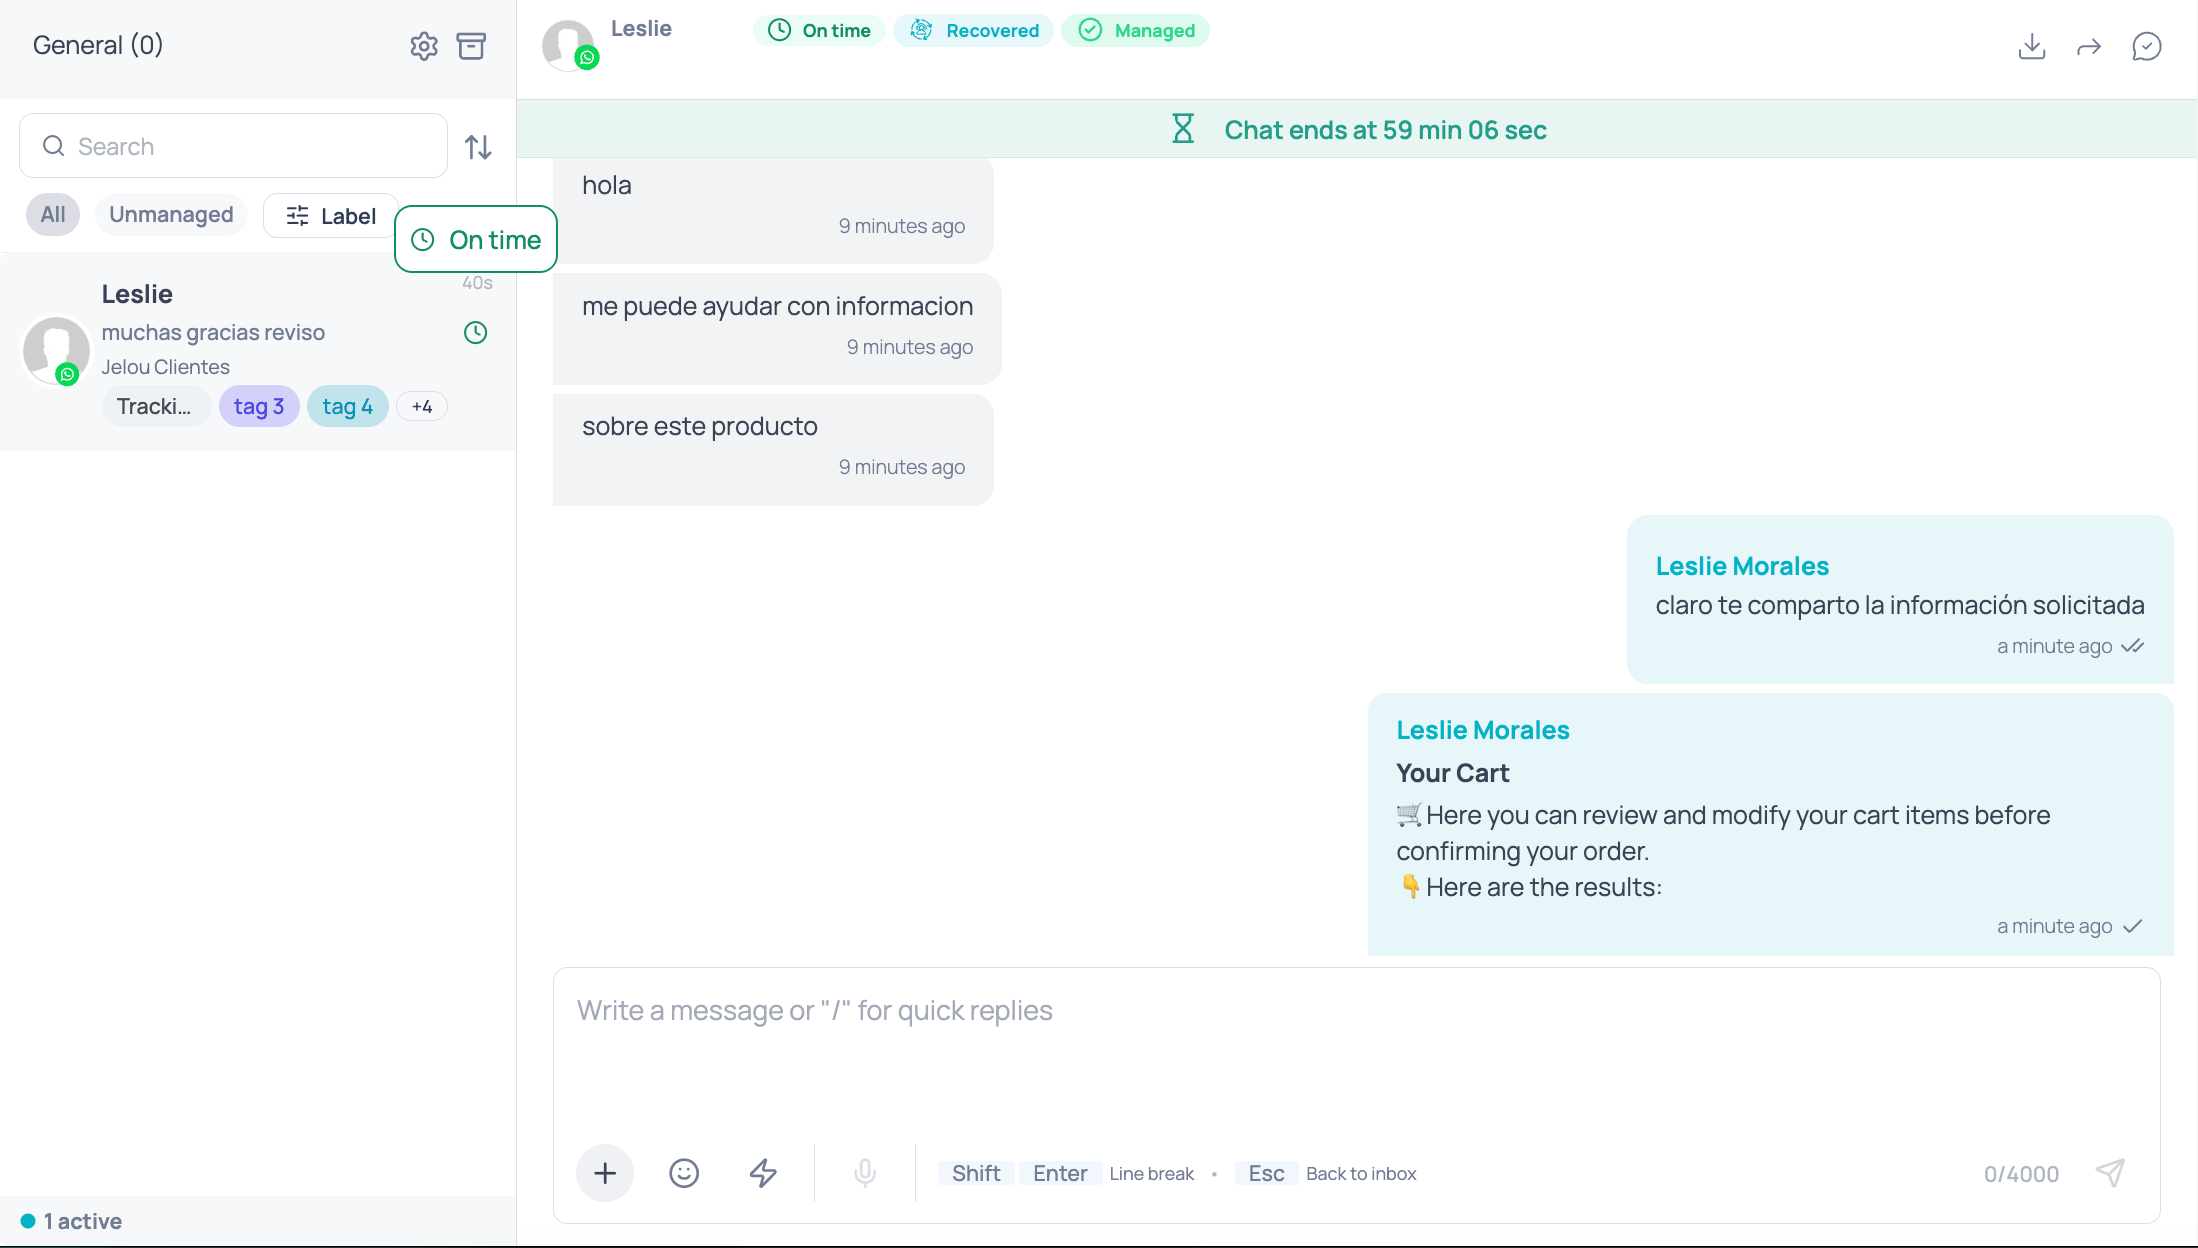 Each conversation uses the thresholds of its **assigned team**; if that team has no configuration of its own, the company's thresholds are used.
### In Live Monitoring
In **Monitoring > Live > Chats**, the traffic light adds a column, a summary of counters, and a filter.
Monitoring labels the middle status **In delay**, while the settings screen calls it **Delayed**. Both are the same status.
#### Attention column
In the active conversations table, an **Attention** column appears next to the operator column, because the status indicates what that operator owes.
Each conversation uses the thresholds of its **assigned team**; if that team has no configuration of its own, the company's thresholds are used.
### In Live Monitoring
In **Monitoring > Live > Chats**, the traffic light adds a column, a summary of counters, and a filter.
Monitoring labels the middle status **In delay**, while the settings screen calls it **Delayed**. Both are the same status.
#### Attention column
In the active conversations table, an **Attention** column appears next to the operator column, because the status indicates what that operator owes.
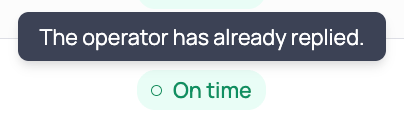
 The chip has two treatments and the difference matters. The tooltip clarifies which of the two cases it is.
**Solid dot**: the assigned operator still owes a reply. This is a conversation you can act on right now.
The chip has two treatments and the difference matters. The tooltip clarifies which of the two cases it is.
**Solid dot**: the assigned operator still owes a reply. This is a conversation you can act on right now.
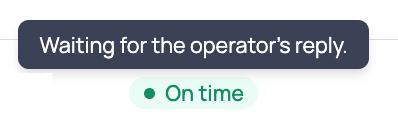 **Hollow dot (outline)**: the turn is already closed, the operator has replied. It tells you how the interaction ended, but requires no action.
 If a conversation has no calculated status, the cell shows `--`.
**Attention is not the same as "Managed".** A conversation can be listed as managed and be in serious delay right now, because the customer sent a new message afterwards.
#### Attention summary
In the **Attention time** statistics card, an **Attention summary** row shows three counters: how many active conversations are on time, in delay, and serious delay.
If a conversation has no calculated status, the cell shows `--`.
**Attention is not the same as "Managed".** A conversation can be listed as managed and be in serious delay right now, because the customer sent a new message afterwards.
#### Attention summary
In the **Attention time** statistics card, an **Attention summary** row shows three counters: how many active conversations are on time, in delay, and serious delay.
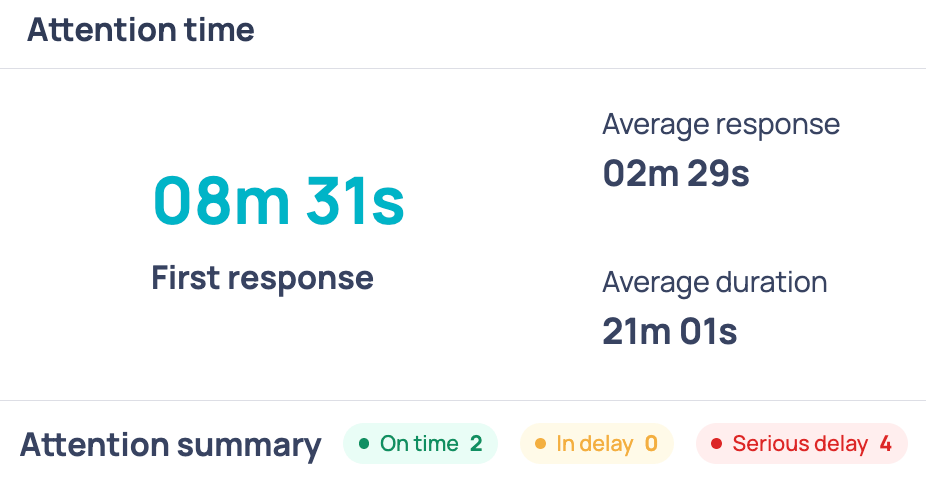 The counters:
* Cover **all active conversations** measured by the traffic light, not just those on the page you are viewing.
* Respect the **team filter**, but not the status filter or pagination.
* Count by status, regardless of whether the operator has already replied.
#### Filter by attention status
The **Filters** panel in the Monitoring header adds an **Attention** selector that lets you keep only the conversations that are on time, in delay, or serious delay.
#### Real-time updates
The status updates on its own: when a conversation changes status, the table repaints that row and adjusts the counters. There is no timer counting seconds on screen; the row changes when the status actually changes.
A supervisor filtered to a specific team only receives updates for that team's conversations.
How to supervise the state of your operation in real time.
### In Reports
The **cases** report you download includes a **Wait time** column with each conversation's status, written as text: `On time`, `In delay`, or `Serious delay`.
The column contains no minutes and no colors: it summarizes in a single value the average attention that conversation received.
The counters:
* Cover **all active conversations** measured by the traffic light, not just those on the page you are viewing.
* Respect the **team filter**, but not the status filter or pagination.
* Count by status, regardless of whether the operator has already replied.
#### Filter by attention status
The **Filters** panel in the Monitoring header adds an **Attention** selector that lets you keep only the conversations that are on time, in delay, or serious delay.
#### Real-time updates
The status updates on its own: when a conversation changes status, the table repaints that row and adjusts the counters. There is no timer counting seconds on screen; the row changes when the status actually changes.
A supervisor filtered to a specific team only receives updates for that team's conversations.
How to supervise the state of your operation in real time.
### In Reports
The **cases** report you download includes a **Wait time** column with each conversation's status, written as text: `On time`, `In delay`, or `Serious delay`.
The column contains no minutes and no colors: it summarizes in a single value the average attention that conversation received.