> ## Documentation Index
> Fetch the complete documentation index at: https://docs.jelou.ai/llms.txt
> Use this file to discover all available pages before exploring further.
# Monitor
> View performance metrics and activity logs for your database
The **Monitor** section lets you supervise the status and performance of your database in real time. Access it from the chart icon in the left sidebar.
## Metrics
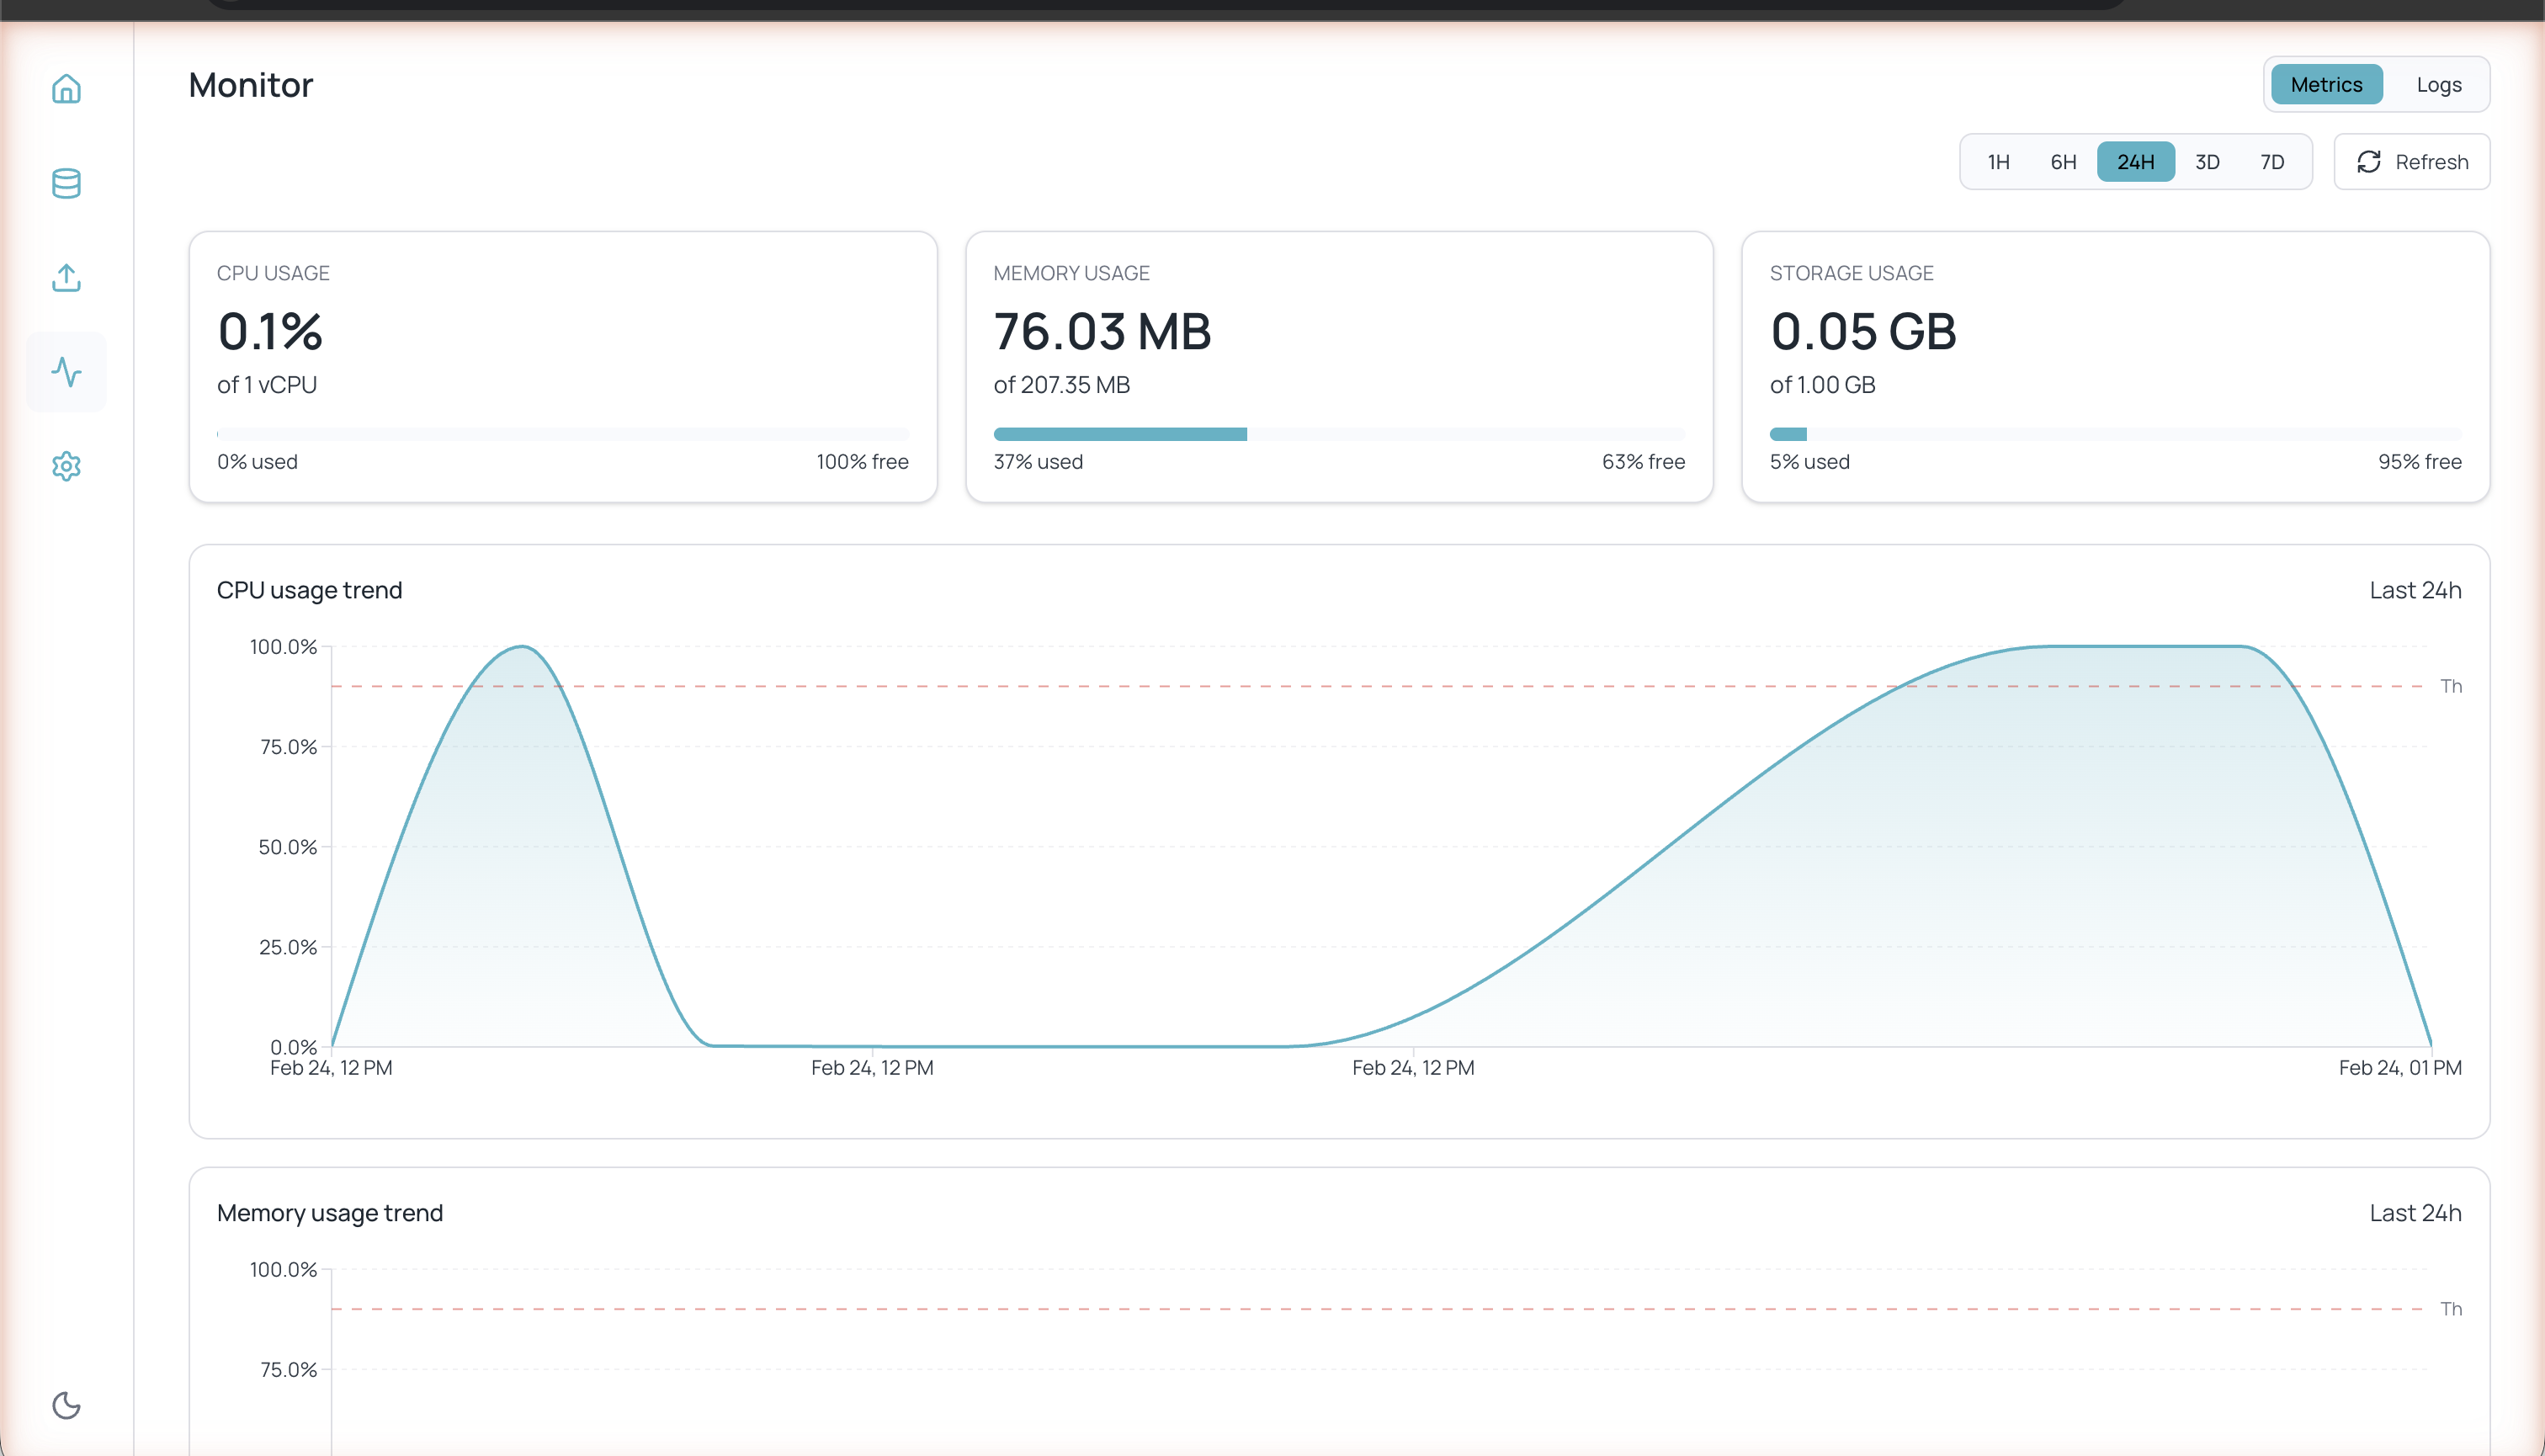 The **Metrics** tab shows three main indicators:
| Metric | Description |
| ----------------- | ------------------------------------------------------------ |
| **CPU Usage** | CPU usage percentage for your instance (e.g. 0.2% of 1 vCPU) |
| **Memory Usage** | RAM used vs. available (e.g. 75.41 MB of 207.35 MB) |
| **Storage Usage** | Storage space used vs. total (e.g. 0.05 GB of 1.00 GB) |
Each metric includes a visual bar showing the usage percentage and free space.
### Trend charts
Below the indicators you will find trend charts for **CPU usage trend** and **Memory usage trend**. Each chart includes a dashed red line indicating the alert threshold.
### Time ranges
You can adjust the metrics period with the range buttons:
| Range | Description |
| ------- | ----------------------- |
| **1H** | Last hour |
| **6H** | Last 6 hours |
| **24H** | Last 24 hours (default) |
| **3D** | Last 3 days |
| **7D** | Last 7 days |
Click **Refresh** to update the data in real time.
## Logs
The **Metrics** tab shows three main indicators:
| Metric | Description |
| ----------------- | ------------------------------------------------------------ |
| **CPU Usage** | CPU usage percentage for your instance (e.g. 0.2% of 1 vCPU) |
| **Memory Usage** | RAM used vs. available (e.g. 75.41 MB of 207.35 MB) |
| **Storage Usage** | Storage space used vs. total (e.g. 0.05 GB of 1.00 GB) |
Each metric includes a visual bar showing the usage percentage and free space.
### Trend charts
Below the indicators you will find trend charts for **CPU usage trend** and **Memory usage trend**. Each chart includes a dashed red line indicating the alert threshold.
### Time ranges
You can adjust the metrics period with the range buttons:
| Range | Description |
| ------- | ----------------------- |
| **1H** | Last hour |
| **6H** | Last 6 hours |
| **24H** | Last 24 hours (default) |
| **3D** | Last 3 days |
| **7D** | Last 7 days |
Click **Refresh** to update the data in real time.
## Logs
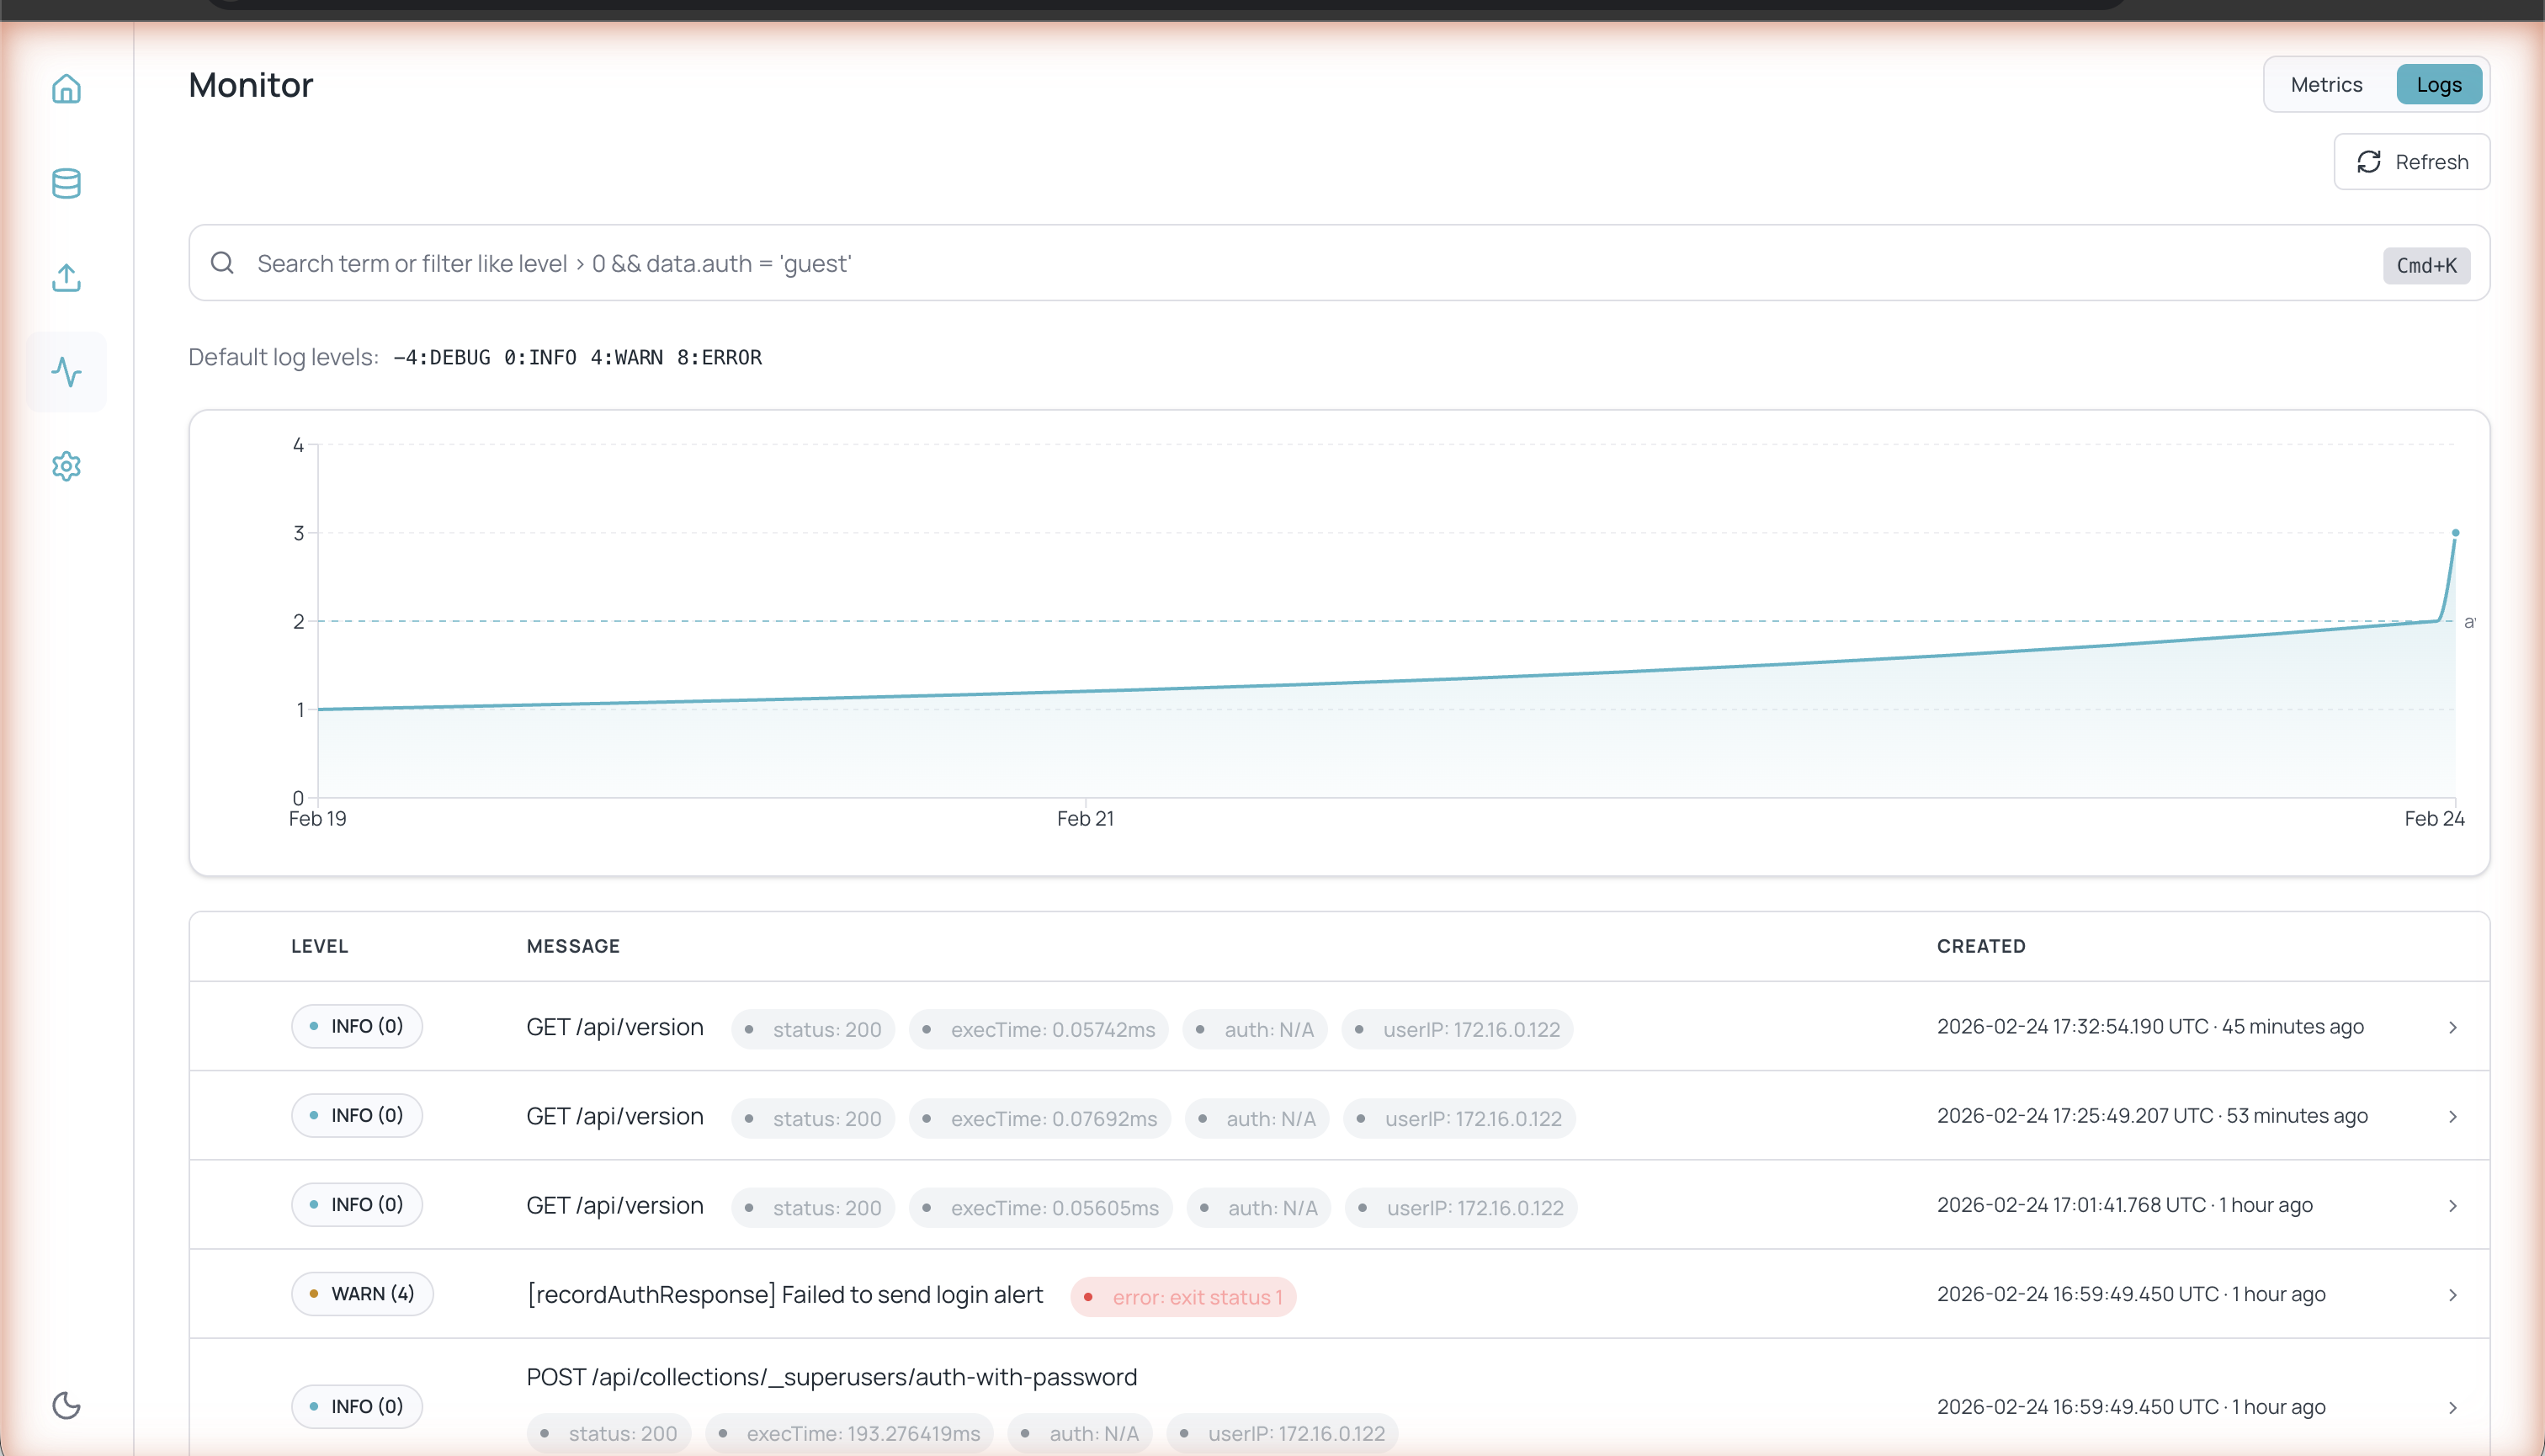 The **Logs** tab shows a chronological record of all activity in your database:
* **API requests** (GET, POST, PUT, DELETE) with status code, execution time, and IP address
* **System errors and warnings**
* **Authentication events**
### Log levels
| Level | Code | Description |
| --------- | ---- | ---------------------------------- |
| **DEBUG** | -4 | Detailed information for diagnosis |
| **INFO** | 0 | Normal system operations |
| **WARN** | 4 | Situations that require attention |
| **ERROR** | 8 | Errors that require action |
### Searching and filtering logs
Use the search bar at the top to filter logs. You can search by free text or use filter expressions such as:
```
level > 0 && data.auth = 'guest'
```
The timeline chart above the log table shows the distribution of events over time, letting you identify activity spikes or errors.
The **Logs** tab shows a chronological record of all activity in your database:
* **API requests** (GET, POST, PUT, DELETE) with status code, execution time, and IP address
* **System errors and warnings**
* **Authentication events**
### Log levels
| Level | Code | Description |
| --------- | ---- | ---------------------------------- |
| **DEBUG** | -4 | Detailed information for diagnosis |
| **INFO** | 0 | Normal system operations |
| **WARN** | 4 | Situations that require attention |
| **ERROR** | 8 | Errors that require action |
### Searching and filtering logs
Use the search bar at the top to filter logs. You can search by free text or use filter expressions such as:
```
level > 0 && data.auth = 'guest'
```
The timeline chart above the log table shows the distribution of events over time, letting you identify activity spikes or errors.