> ## Documentation Index
> Fetch the complete documentation index at: https://docs.jelou.ai/llms.txt
> Use this file to discover all available pages before exploring further.
# Test your workflows
> Test your workflows directly from the Brain Studio canvas with a panel that shows the conversation, executed nodes, and the detail of each step.
The Tester is the panel that opens from the canvas to test a workflow before publishing it. You can send messages as if you were an end user, see every node that executes, and inspect input, output, and state at any step of the flow. It shares the same visual interface as the [production Debugger](/en/guides/getting-started/ejecuciones-workflow), so learning one is learning the other.
 ## Open the Tester
In the canvas top bar, click **Test**. A side panel will open with the workflow header, the conversation area, and a field to type messages.
If the workflow has never been executed, the first message you send starts a new session. Each session counts as one execution (see [Workflow Executions](/en/guides/getting-started/ejecuciones-workflow)).
## Messages view and Execution view
The panel has a toggle at the bottom with two modes:
| Mode | What it shows |
| ------------- | ------------------------------------------------------------------------------------------------------------------------------ |
| **Messages** | Only the conversation between the bot and the simulated user. Useful to validate the conversational flow without distractions. |
| **Execution** | Conversation + indicators for every workflow node that executed (icon, name, and status). Useful to debug internal logic. |
## Open the Tester
In the canvas top bar, click **Test**. A side panel will open with the workflow header, the conversation area, and a field to type messages.
If the workflow has never been executed, the first message you send starts a new session. Each session counts as one execution (see [Workflow Executions](/en/guides/getting-started/ejecuciones-workflow)).
## Messages view and Execution view
The panel has a toggle at the bottom with two modes:
| Mode | What it shows |
| ------------- | ------------------------------------------------------------------------------------------------------------------------------ |
| **Messages** | Only the conversation between the bot and the simulated user. Useful to validate the conversational flow without distractions. |
| **Execution** | Conversation + indicators for every workflow node that executed (icon, name, and status). Useful to debug internal logic. |
 ## Node indicators
In Execution view, every workflow node that runs during the test appears as a small card interleaved with the messages. The card shows:
* **Canvas icon** of the node (Start, HTTP, Code, AI Agent, Conditional, Tool, etc.)
* **Node name** as configured in the canvas
* **Status** (green for success, red for error)
When several nodes execute in sequence within the same execution, they are grouped into a single card with a footer (`N nodes · Xms total`). If the workflow calls a sub-skill, the inner sub-skill nodes appear as a separate group to mark the execution boundary.
## Node indicators
In Execution view, every workflow node that runs during the test appears as a small card interleaved with the messages. The card shows:
* **Canvas icon** of the node (Start, HTTP, Code, AI Agent, Conditional, Tool, etc.)
* **Node name** as configured in the canvas
* **Status** (green for success, red for error)
When several nodes execute in sequence within the same execution, they are grouped into a single card with a footer (`N nodes · Xms total`). If the workflow calls a sub-skill, the inner sub-skill nodes appear as a separate group to mark the execution boundary.
 ## Node detail panel
Clicking on any indicator opens a resizable side panel with the full execution information for that node:
The exact payload that entered the node.
What the node returned (response, generated message, conditional result, etc.).
Snapshot of `$memory` and `$context` before and after the node executed.
If the node failed, message and stack trace.
### Copy the path of a value
Click any key inside the JSON of `Initial state` or `Final state` to copy the full path in bracket notation to the clipboard. For example, clicking the `url` key inside `finalState.tool` copies `finalState.tool.url`. A "Copied ✓" tooltip confirms the action.
The copied path pastes directly into any variable expression field (`{{finalState.tool.url}}`) or bug report without having to rebuild it manually.
## Detail panel actions
Above the input/output, the panel has contextual buttons:
Centers the canvas behind the Tester on the corresponding node. Only appears for nodes in the active workflow. For internal sub-skill nodes, the button is hidden because the node does not live in this canvas.
Only appears for Tool-type nodes. Opens the Tool's internal execution with the full list of inner nodes that ran, including their own input/output/errors.
## Interactive bubbles
Bubbles that are interactive in production (buttons, lists, CTAs) are now clickable inside the Tester. You don't have to manually type the response to advance the flow: click the button as the end user would.
| Bubble type | How to simulate |
| ----------------- | -------------------------------------------------------------------------------------------------------------------------------------------------------------- |
| **Quick replies** | Pill-style buttons under the message. Click sends the `payload.targetId` and advances to the destination node. |
| **List options** | Cards with title and optional description. Click resolves the option against `node.configuration.messages[0].options` and advances through the correct branch. |
| **CTA URL** | Button with an external-link icon. Click opens the URL in a new browser tab. Does not advance the flow (same as on WhatsApp). |
| **Carousel** | Horizontal cards with image, title, and description. The URL button opens the link in a new tab. |
## Node detail panel
Clicking on any indicator opens a resizable side panel with the full execution information for that node:
The exact payload that entered the node.
What the node returned (response, generated message, conditional result, etc.).
Snapshot of `$memory` and `$context` before and after the node executed.
If the node failed, message and stack trace.
### Copy the path of a value
Click any key inside the JSON of `Initial state` or `Final state` to copy the full path in bracket notation to the clipboard. For example, clicking the `url` key inside `finalState.tool` copies `finalState.tool.url`. A "Copied ✓" tooltip confirms the action.
The copied path pastes directly into any variable expression field (`{{finalState.tool.url}}`) or bug report without having to rebuild it manually.
## Detail panel actions
Above the input/output, the panel has contextual buttons:
Centers the canvas behind the Tester on the corresponding node. Only appears for nodes in the active workflow. For internal sub-skill nodes, the button is hidden because the node does not live in this canvas.
Only appears for Tool-type nodes. Opens the Tool's internal execution with the full list of inner nodes that ran, including their own input/output/errors.
## Interactive bubbles
Bubbles that are interactive in production (buttons, lists, CTAs) are now clickable inside the Tester. You don't have to manually type the response to advance the flow: click the button as the end user would.
| Bubble type | How to simulate |
| ----------------- | -------------------------------------------------------------------------------------------------------------------------------------------------------------- |
| **Quick replies** | Pill-style buttons under the message. Click sends the `payload.targetId` and advances to the destination node. |
| **List options** | Cards with title and optional description. Click resolves the option against `node.configuration.messages[0].options` and advances through the correct branch. |
| **CTA URL** | Button with an external-link icon. Click opens the URL in a new browser tab. Does not advance the flow (same as on WhatsApp). |
| **Carousel** | Horizontal cards with image, title, and description. The URL button opens the link in a new tab. |
 ## Limitations
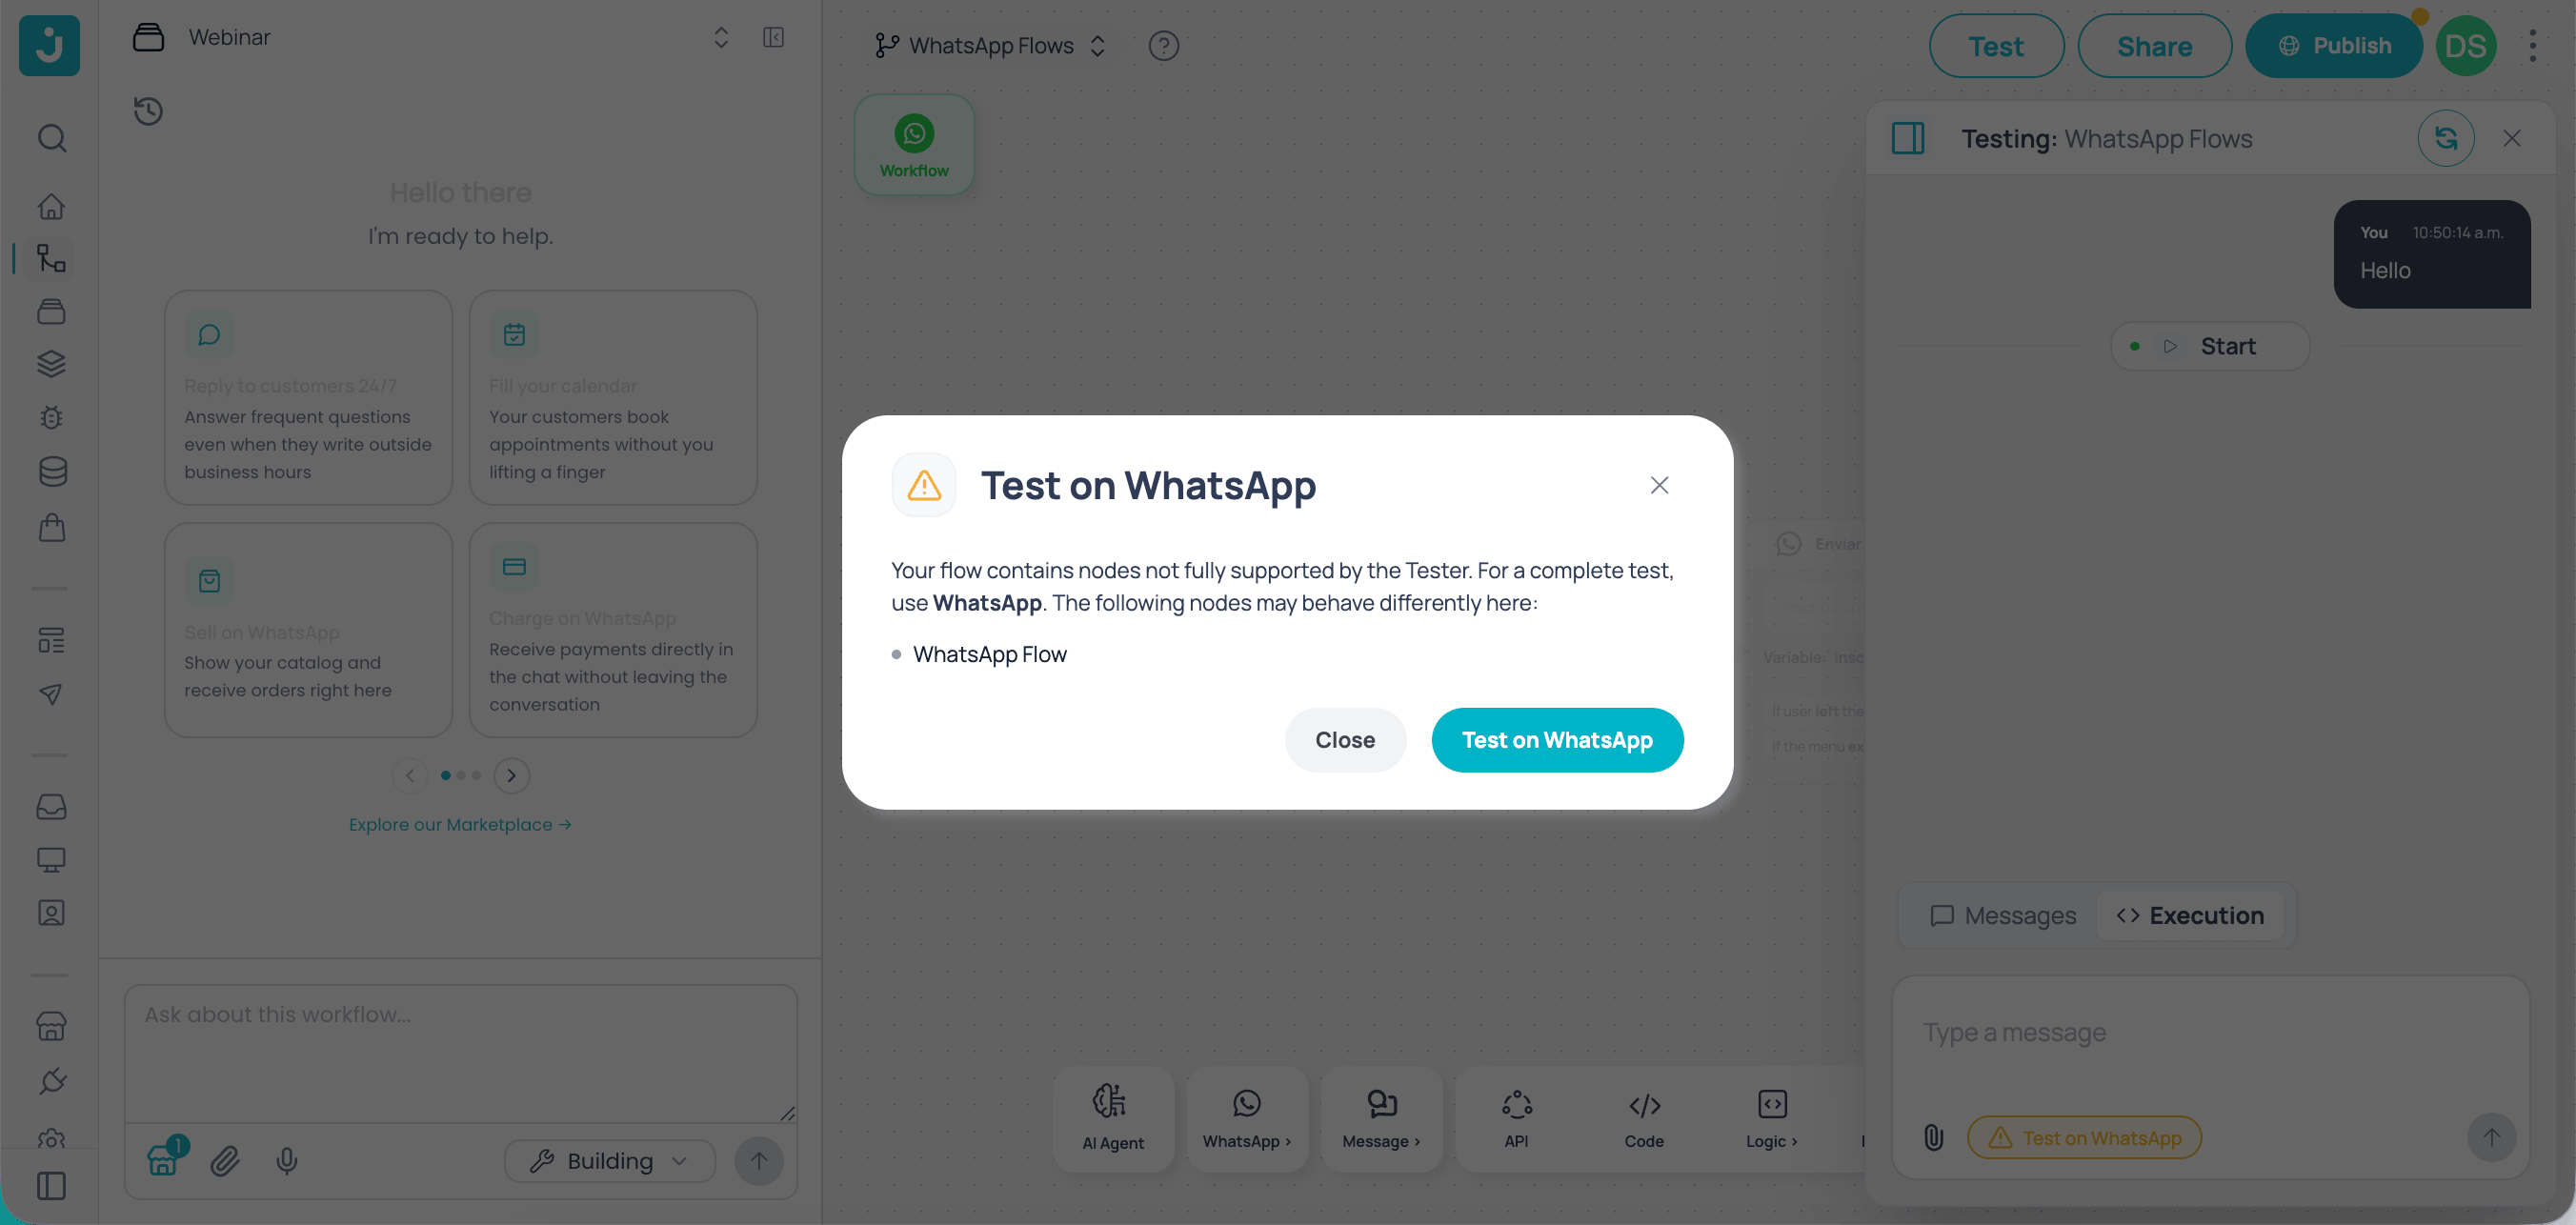
* **Partial node compatibility**: some nodes are not fully supported by the Tester and may behave differently than they would in production. When the Tester detects one of these nodes in your flow, it shows a warning with the option **Test on WhatsApp** for a complete test.
## Limitations
* **Partial node compatibility**: some nodes are not fully supported by the Tester and may behave differently than they would in production. When the Tester detects one of these nodes in your flow, it shows a warning with the option **Test on WhatsApp** for a complete test.
 * **Inner sub-skill nodes**: the **Go to node** button does not apply to nodes that live on a different canvas than the active one. To inspect them, open the sub-skill separately or use **Debug Tool** if the container is a Tool.
* **Tests don't affect production**: the Tester session is independent of real traffic. Conversations, variables, and memory you generate here are not logged in the [production Debugger](/en/guides/getting-started/ejecuciones-workflow) and don't count as real user conversations (they do count as executions for billing).
* **One session at a time**: if you close the Tester without finishing a conversation, the session is discarded. The next time you click **Test**, a new one starts.
## Use cases
A telco team builds a flow that validates invoices via API. The API responds inconsistently and the flow breaks in production. They run the test in the Tester, click the failing HTTP node, see the full request and response, and copy the path of the problematic field to report it to the backend team, all without leaving the builder.
A retail QA team validates subscription billing flows before each release. One Conditional branch always causes problems because the matching logic depends on strings with accents. They run the test, see exactly which term matched in the Conditional node panel, and fix it without escalating to engineering.
A product manager configures an AI Agent that asks for name and email and saves them into `$memory.datosUsuarios`. From the Tester they confirm the Final state has the correct structure (`{ nombre, correo }`), copy the path `finalState.datosUsuarios.correo`, and use it in the next text node without rebuilding it manually.
A parent workflow calls an identity-validation sub-skill. In the Tester they see the sub-skill rendered as a separate group of indicators. They click the Tool node inside the sub-skill and use **Debug Tool** to inspect the Tool's internal execution without opening the sub-skill in another tab.
A builder constructs a flow with a Buttons node offering three options. Instead of typing "1", "2", or "3" manually as before, they click the button directly inside the Tester and the flow advances to the correct destination node, just like the end user will on WhatsApp.
## Related articles
Build your first workflow step by step and test it from the Tester.
How executions are counted and their impact on billing.
Generate a public link or private WhatsApp session so your team can test the workflow.
When the flow is ready in the Tester, publish a version for production.
* **Inner sub-skill nodes**: the **Go to node** button does not apply to nodes that live on a different canvas than the active one. To inspect them, open the sub-skill separately or use **Debug Tool** if the container is a Tool.
* **Tests don't affect production**: the Tester session is independent of real traffic. Conversations, variables, and memory you generate here are not logged in the [production Debugger](/en/guides/getting-started/ejecuciones-workflow) and don't count as real user conversations (they do count as executions for billing).
* **One session at a time**: if you close the Tester without finishing a conversation, the session is discarded. The next time you click **Test**, a new one starts.
## Use cases
A telco team builds a flow that validates invoices via API. The API responds inconsistently and the flow breaks in production. They run the test in the Tester, click the failing HTTP node, see the full request and response, and copy the path of the problematic field to report it to the backend team, all without leaving the builder.
A retail QA team validates subscription billing flows before each release. One Conditional branch always causes problems because the matching logic depends on strings with accents. They run the test, see exactly which term matched in the Conditional node panel, and fix it without escalating to engineering.
A product manager configures an AI Agent that asks for name and email and saves them into `$memory.datosUsuarios`. From the Tester they confirm the Final state has the correct structure (`{ nombre, correo }`), copy the path `finalState.datosUsuarios.correo`, and use it in the next text node without rebuilding it manually.
A parent workflow calls an identity-validation sub-skill. In the Tester they see the sub-skill rendered as a separate group of indicators. They click the Tool node inside the sub-skill and use **Debug Tool** to inspect the Tool's internal execution without opening the sub-skill in another tab.
A builder constructs a flow with a Buttons node offering three options. Instead of typing "1", "2", or "3" manually as before, they click the button directly inside the Tester and the flow advances to the correct destination node, just like the end user will on WhatsApp.
## Related articles
Build your first workflow step by step and test it from the Tester.
How executions are counted and their impact on billing.
Generate a public link or private WhatsApp session so your team can test the workflow.
When the flow is ready in the Tester, publish a version for production.