Metrics
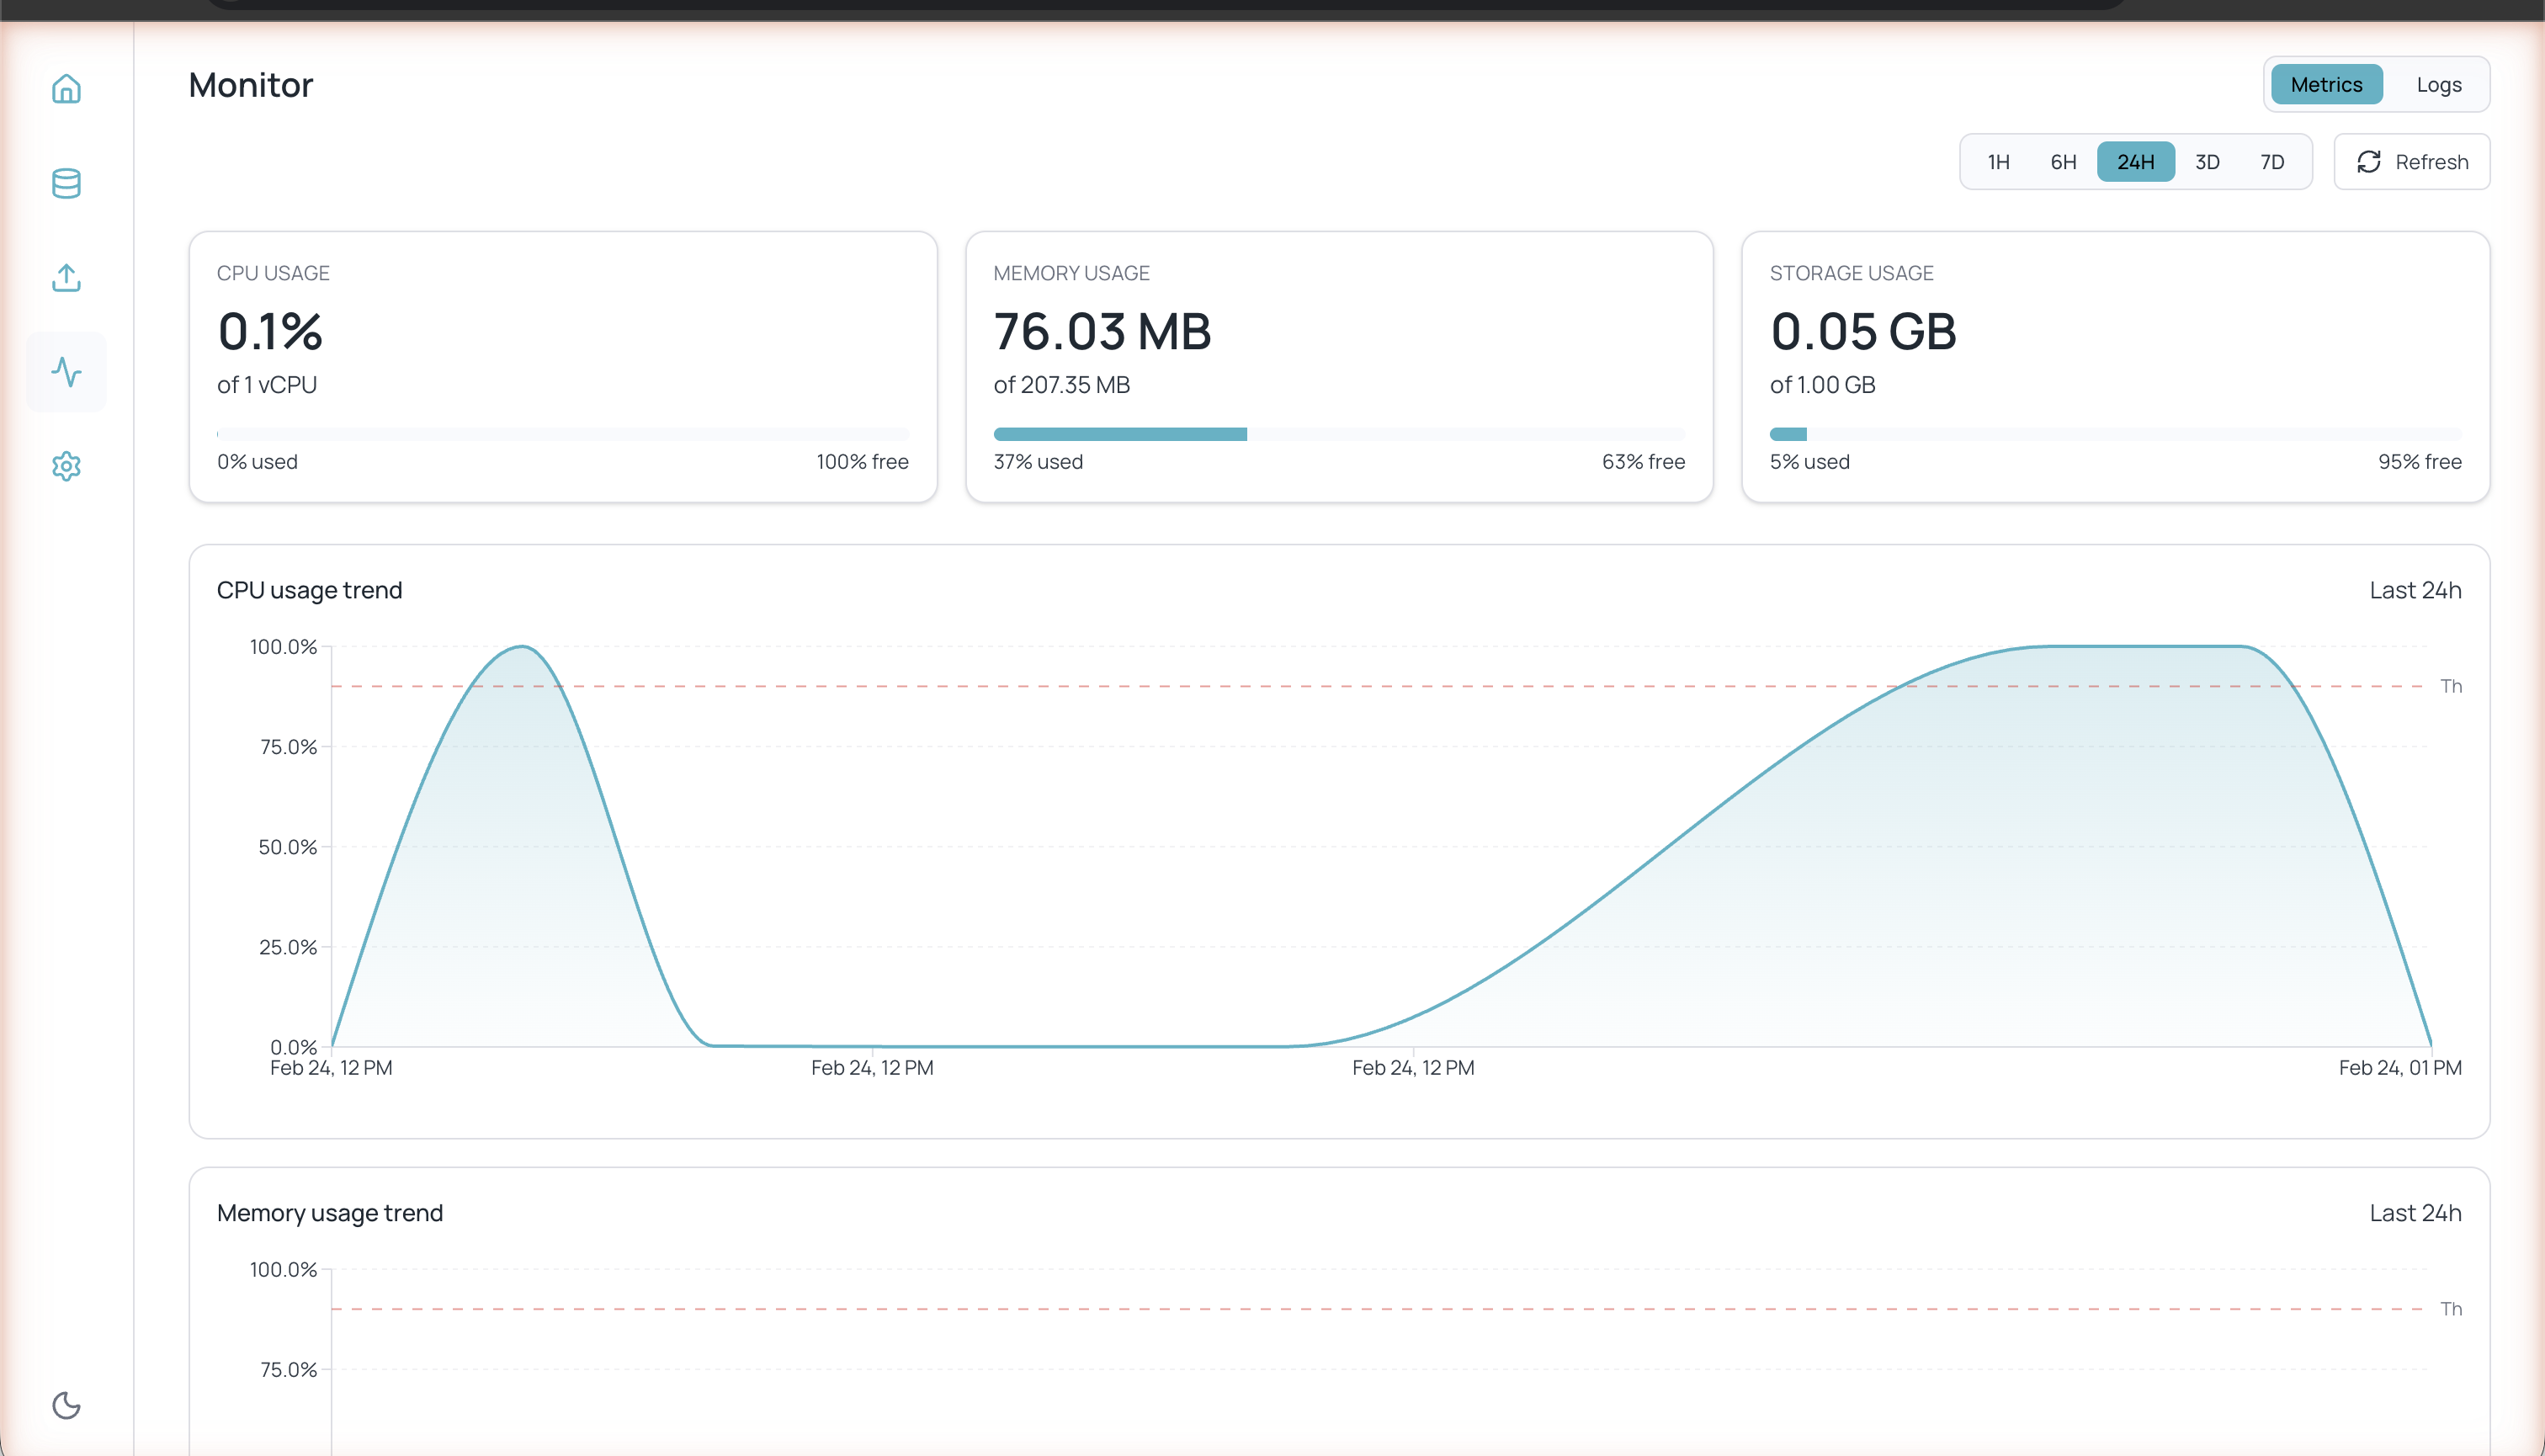
Performance metrics with CPU, memory, and storage indicators
Each metric includes a visual bar showing the usage percentage and free space.
Trend charts
Below the indicators you will find trend charts for CPU usage trend and Memory usage trend. Each chart includes a dashed red line indicating the alert threshold.Time ranges
You can adjust the metrics period with the range buttons:
Click Refresh to update the data in real time.
Logs
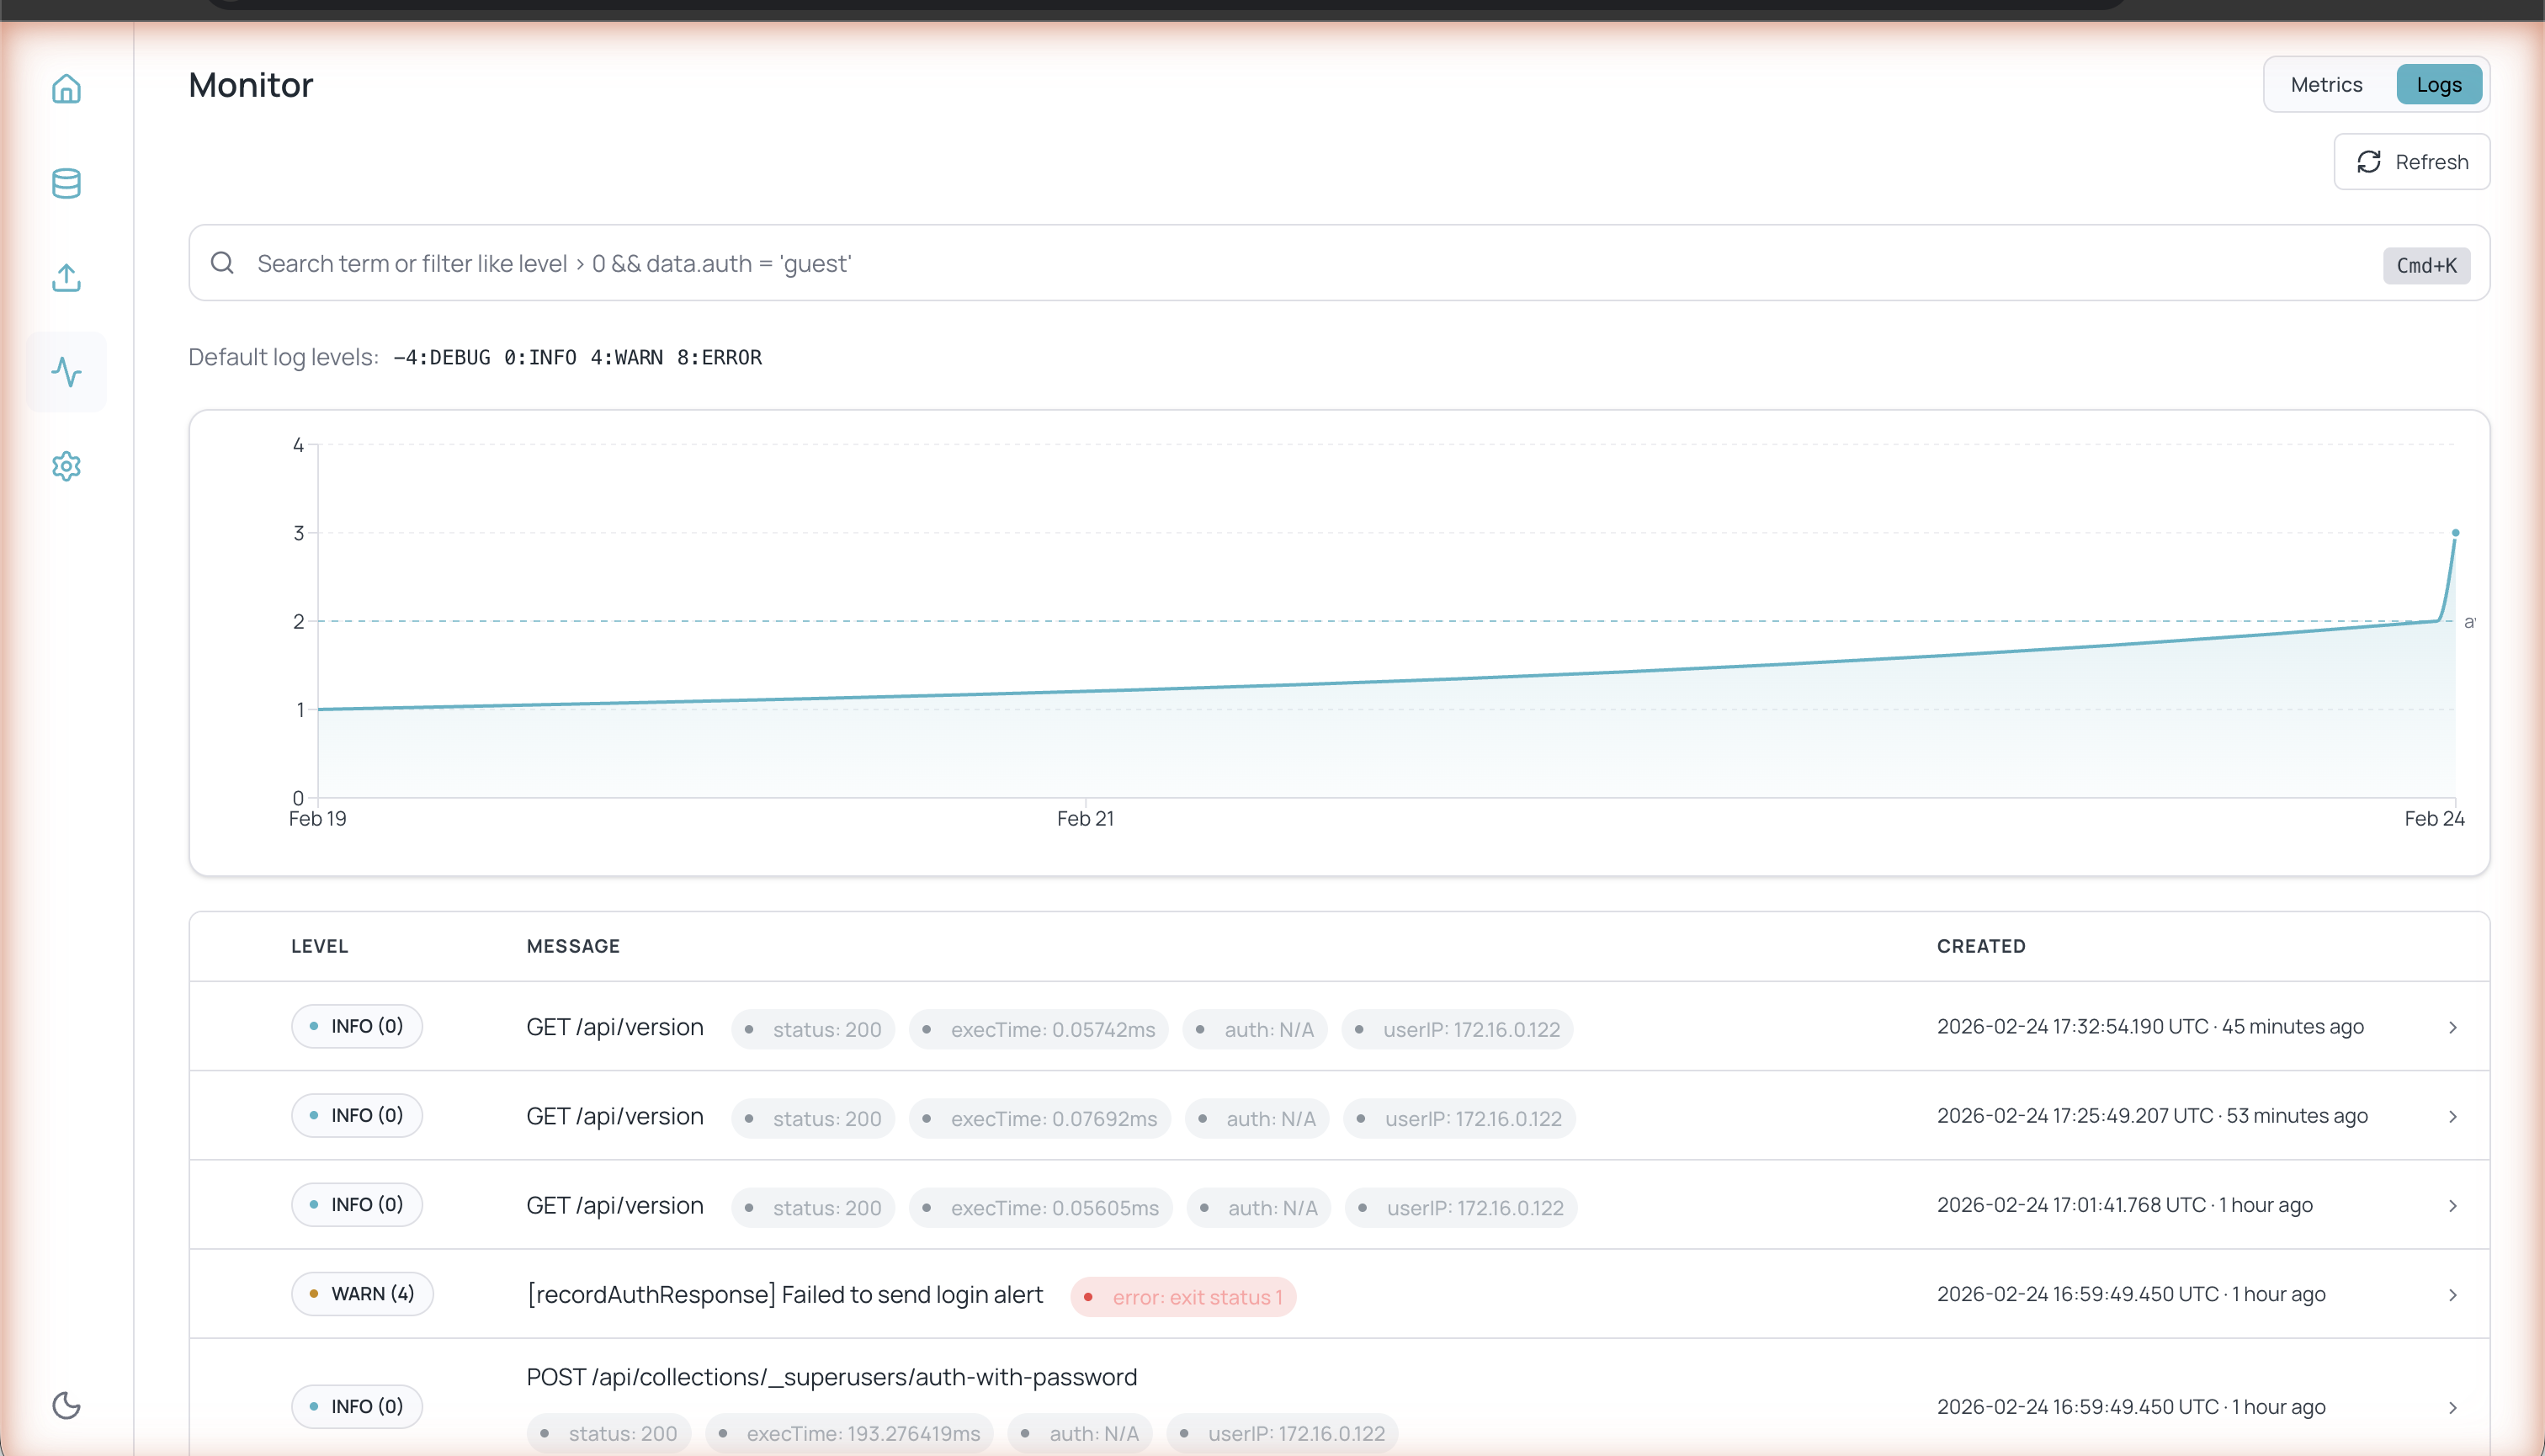
Activity logs with timeline, levels, and request details
- API requests (GET, POST, PUT, DELETE) with status code, execution time, and IP address
- System errors and warnings
- Authentication events